In this post we are going to be looking at a Power Test for Strength Exercises. In our case, as this is a Calisthenics site, we will be referring to the Pull Ups but it could perfectly be done with some other strength elements.
The power test can be a very useful thing to do because it’s going to tell you the weight where you can perform the highest power, so if you want to work for power, you know which weight to use. And also is a good way to keep track of your progress, as if you take the test now and in half a year, you will see how you evolved, if you got better in higher weights or lower weights, or you increased the overall power… etc.
I took this test 8 months ago so you will see my previous results and the results I obtained now, and we will compare them and get come conclusions.
Well actually… it’s going to be a test, but we are going to analyse two results as for the first one we will be using a so called “w5” test (which basically means measuring the number of repetitions you can do within 5 seconds with different weights) and then a 1 repetition power test (which it’s going to measure the power by calculating the duration of 1 single pull up).

Let’s start from the beginning.
How do we measure power? Well, let’s do a quick physics recall. We know that the Power can be measured as P = F * v (force per velocity). And for those two variables we know that F = m*a (mass per acceleration) and that the speed can be measured as v = d/t (distance divided by time).
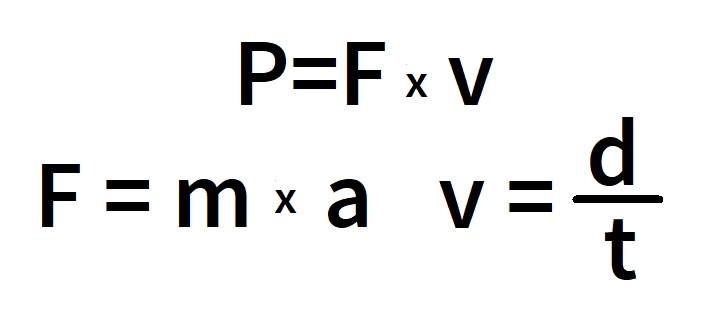
So in order to get the Power we need to find the Force and Velocity. Alright so…. What about the force?
The force it’s going to be the easy one, because in the case of Pull Ups we can compute the force as the total amount of ABSOLUTE weight that is moving upwards (our own bodyweight and the external weight).
To compute the speed, we will have to get the distance and the time. To do that, we will have to measure the distance from the lower pull up position, to the highest pull up position.
To compute the time we have two options:
– Taking a standard time (such as 5 seconds) as a test time.
– Recording the pull up and looking how many frames have you elapsed doing the pull up.
In this post we will be looking and concluding about both ways of tracking the time.
Before start, I want to say that there is a device called encoder, which basically computes the speed of the lift and would make things much easier, but we don’t have encoders here, so we will have to do some more steps.
Okay! Let’s start with the 5 seconds test.
*Excel Template at the end of the post*
The 5 seconds Power Test
First, why 5 seconds? Well 5 seconds is a time easily controllable with a chronometer, there is no qualitative difference between the first rep and the last one and it’s easier for the posterior calculus. A higher time would decrease the speed of execution.
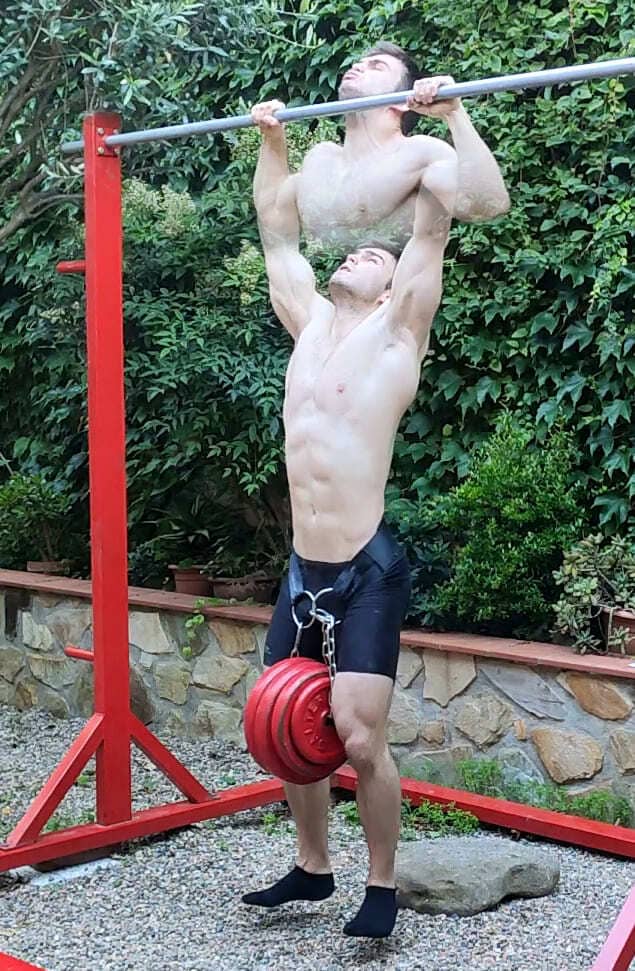
This test consists in doing as many repetitions as you can in 5 seconds (in our case, Pull Ups). There are some considerations, such as how you count the pull ups.
The rule to count the Pull Ups, is that doing the concentric part of the pull up (the way up) will be considered as half a pull up and doing the eccentric part (the descend) will be another half.
This said, let’s talk about the weights we need to use during the test, as you will need to test different types of loads in order to compute the plot that is going to tell you your maximum peak power and optimal weight.
The weights used for this test in the official article (see the reference below) are 25, 45, 65, and 85% of your Maximum Repetition. However, you can do smaller steps in order to get some more data in between although I wouldn’t recommend doing more than 6 different weights.
In case that your Pull Up RM is not very high you can start with bodyweight because what counts is the absolute weight.
In my case, I started with 30Kg, and increased in 10Kg steps until the 90Kg which ranges between the 27-82% of my Maximum Repetition (as my current RM is 110Kg). These means I took 7 different weights just because it was easier for me to increase by 10Kg steps for the plates positioning.
Alright! So now that we know the weights we need to use, let’s perform the test and see how many repetitions we can do with each configuration.
BTW! Between each set you should rest at least 5 minutes, in order to recover from the previous set.
– For the +30Kg I managed to do 4 full repetitions but I think I could have done more if I had the proper swinging, but as I’m not used of doing fast repetitions with lower weights… that was it.
– For the next weight, the 40Kg I also did the exact same 4 repetitions and also with a bit of decontrol.
– The following, 50Kg, 60Kg and 70Kg I kept the speed at 4 full repetitions.
Alright, reached this point, we can realize that due to the swinging I was not able to do more repetitions, that’s one of the issues with this method that won’t appear in the next one.
– With the 80Kg I managed to complete 3 full pull ups.
– And with the 90Kg I just had time to do 2 and a bit more, which just counts as 2 points.
My brother also did the test, and as he is a beginner and his RM is around 30Kg, he started with bodyweight and went up to +20Kg.
– For the first and second sets at bodyweight and with +4Kg he did 3,5 pull ups (so 3 pull ups + the concentric phase).
– Along the 8Kg, 12Kg and 16Kg he managed to maintain the 3 repetitions.
– And for the last weight, at 20Kg, he did 2 and a half pull ups (2 pull ups + concentric).
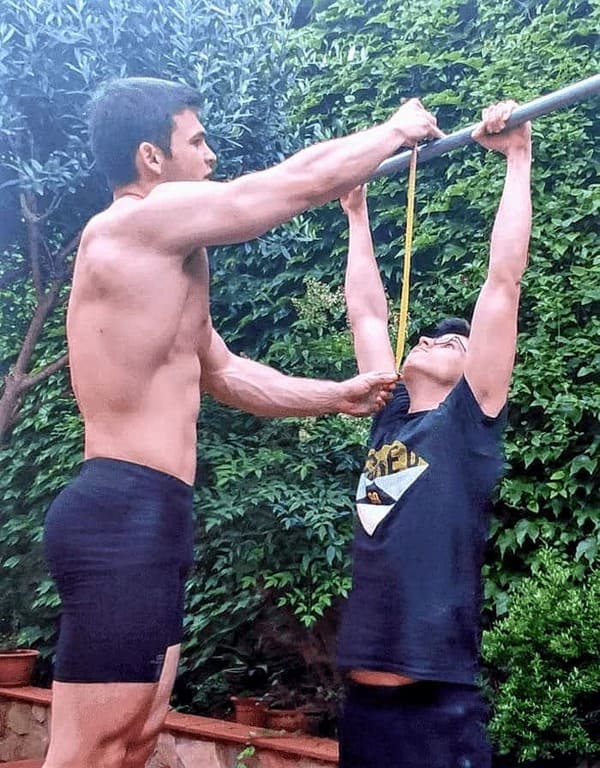
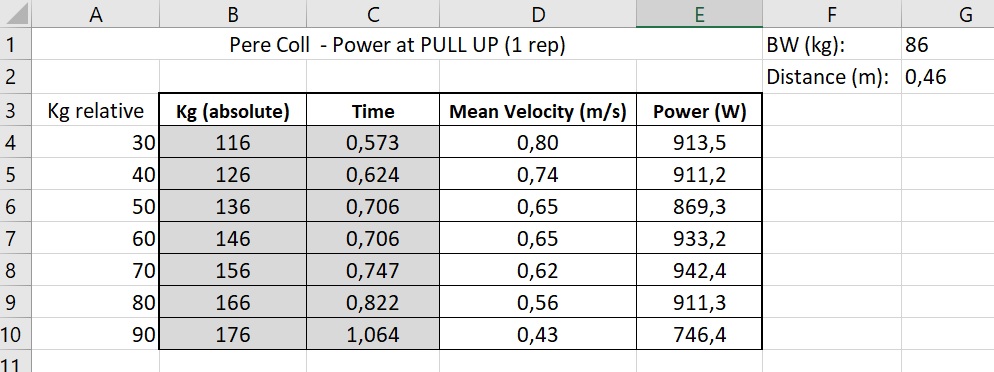
Now that we have all the repetitions data, we need to measure the distance from the lower pull part to the upper part. In my case it’s 46cm and for my brother’s its 54cm. The reason why he has more range is that his grip in not as wide as mine.
All data is ready for some Excel work. We will be analysing my data.
You will create a table as the one below (you have an example for download at the end of the post), with the absolute weight (body weight + added weight) in Kg, the number of repetitions, mean velocity and power.
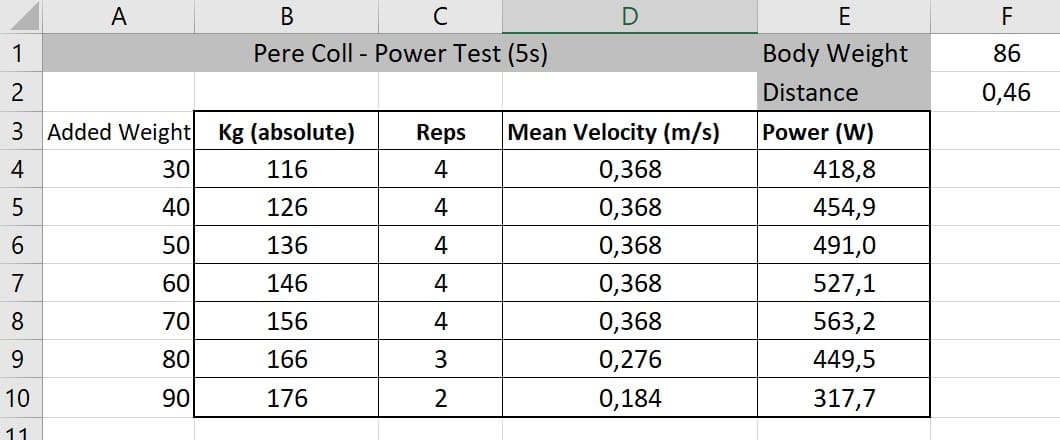
The Mean Velocity will be computed as the (number of repetitions * distance) / by the total test time (5 seconds). I take the distance as one-way movement but if you take it as the sum of the way up + descend the power results will be the same, but multiplied by 2, so it doesn’t really matter.
The Power value will be computed as the mean velocity[m/s] * weight[Kg] * gravity constant [9,81 m/s2].
With this data we will plot the Power [ in Watts ] against the added weight [ in Kg ], so the plot would look like this.
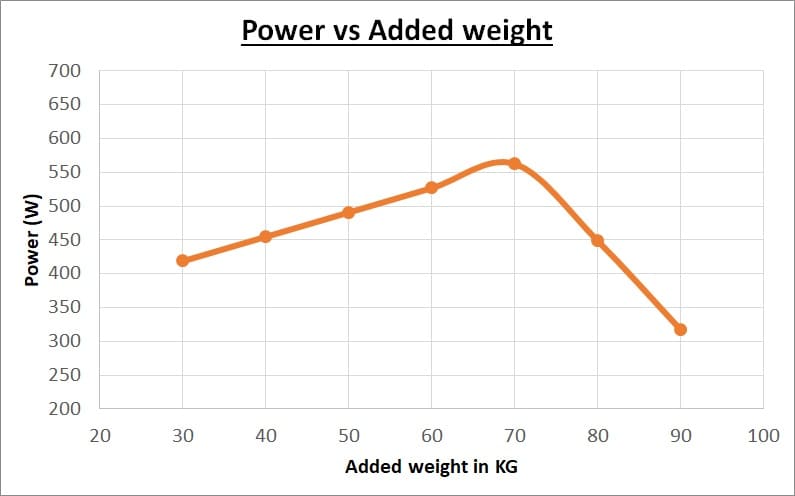
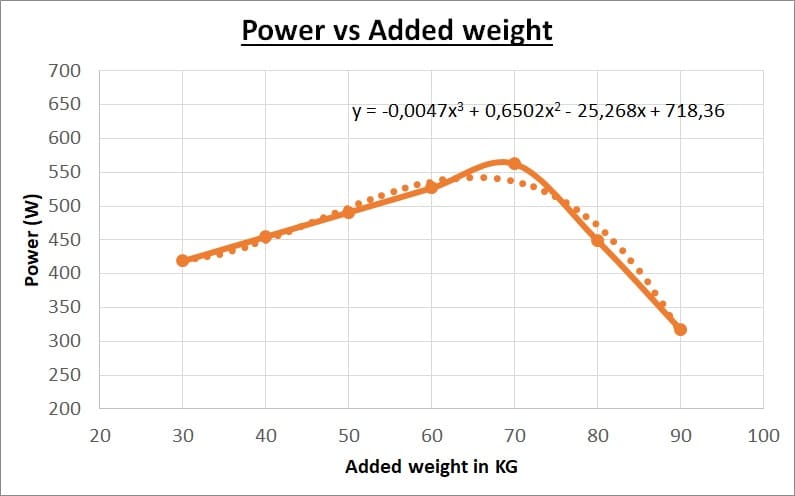
In order to find the peak power we will have to interpolate (I would recommend a 3rd order interpolation for it to be more precise).
In the interpolated plot you can see your peak power, and in the X axis the correspondent weight. This will be the weight that will allow you produce the maximum power.
In my case, I have taken the test twice and you can see in blue the previous record, and in orange the actual record. You can see that the peak has moved to the right, which means that my power and therefore speed has improved with heavier weights.
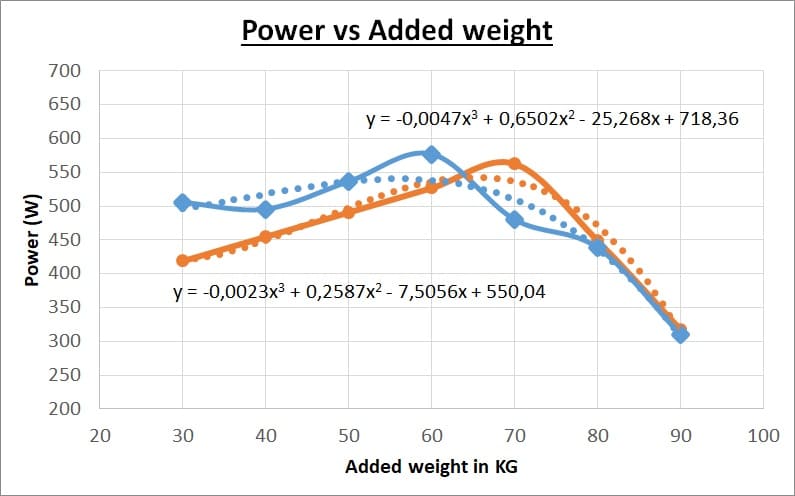
Before, my power peak was around 58Kg, and now it is around 66Kg.
One repetition Power Test
Alright, so now let’s move to another type of doing the test, which in my opinion is more accurate and will allow computing different plots to get more interesting results.
This test consists on measuring the time taken to perform a pull up, but only the concentric part (the way up). We can use the first repetition on the 5 seconds power test to compute the time of the concentric phase. Afterwards, we will use the time and the travelled distance to compute the power. This will avoid the swinging issue but you need to spend some time watching your videos frame by frame in order to get the exact timing.
So I did that with my previous pull up sets and the results were the following:
– Pull Up at +30Kg with 0,57 seconds
– Pull Up at +40Kg with 0,62 seconds
– Pull Up at +50Kg with 0,71 seconds
– Pull Up at +60Kg with 0,71 seconds
– Pull Up at +70Kg with 0,75 seconds
– Pull Up at +80Kg with 0,82 seconds
– Pull Up at +90Kg with 1,06 seconds
So with this data, we will do the same as in the previous method. Open an Excel sheet and build a table with the absolute weight (your body weight + added weight), the time taken for each Pull Up [s], the velocity (distance over time) [m/s] and Power (velocity * weight * gravity constant) [W].
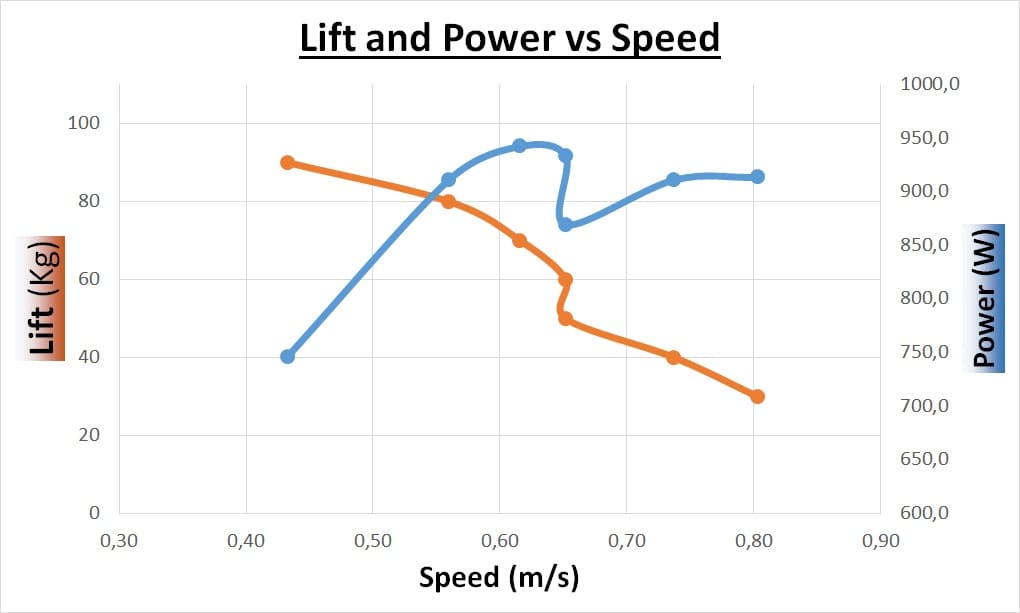
With this data, you can create a plot with 2 different curves, one showing the lift [Kg] vs Speed [m/s] and one showing the power [W] vs the Speed [m/s].
After that, you can interpolate with 2nd order polynomial equation and extrapolate in order to get the extended result for all the weights and speeds.
The result should look like this. (Remember that at the end of the post you can download an Excel template).
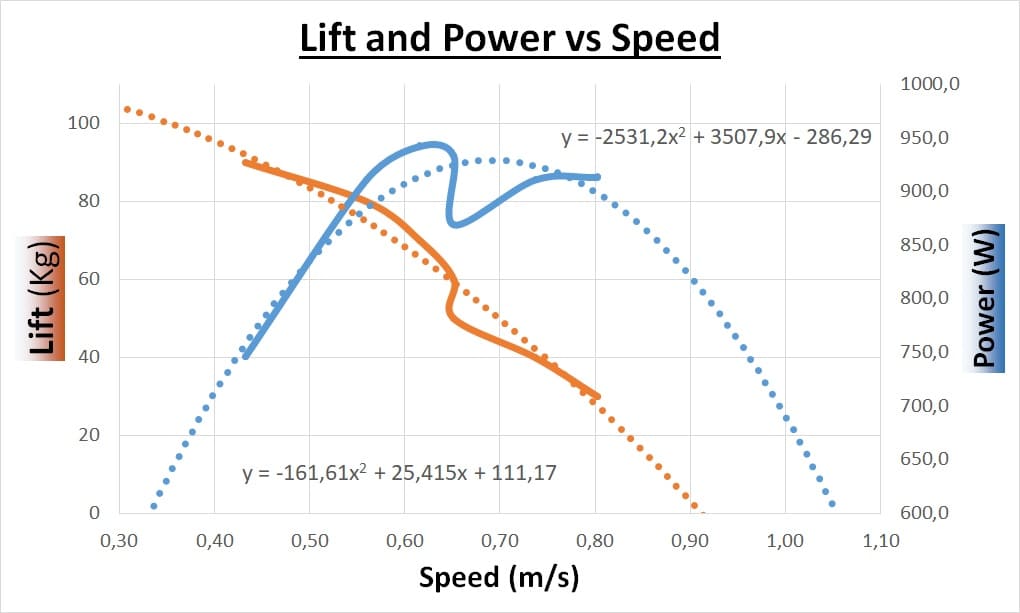
The blue plot shows the power and the orange the added weight. With this chart you can see the speed you are moving each weight, and the power you are producing with every different weight. In order to get your maximum Power weight, you should do the following.
Get the maximum point on the power plot (blue) and bring it down until you reach the force curve (the orange one) without any movement in the X axis. See the image below:
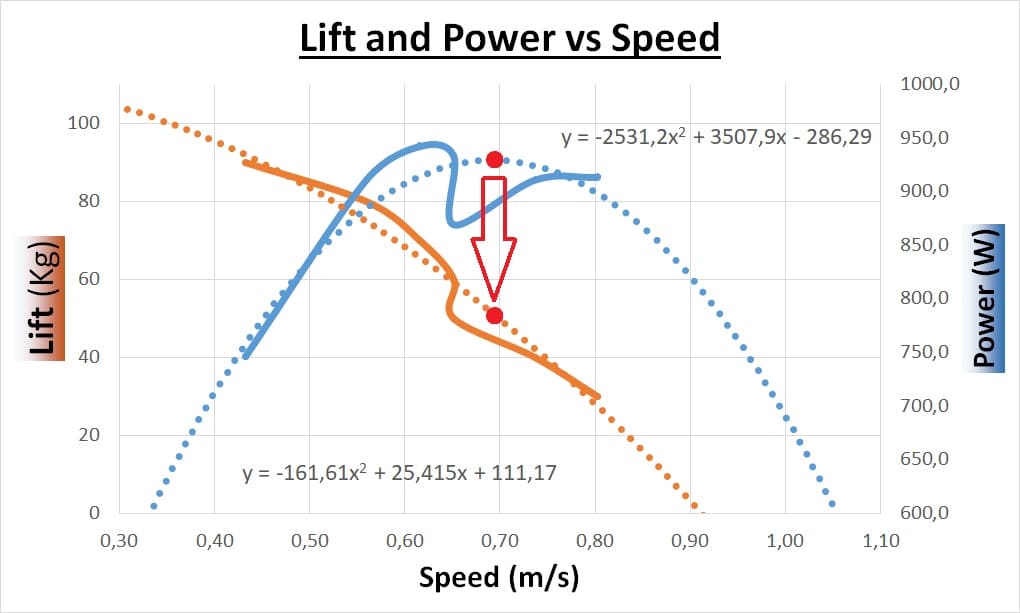
Then, you need to see the corresponding added weight value, so you just need to see that value in the Y axis.
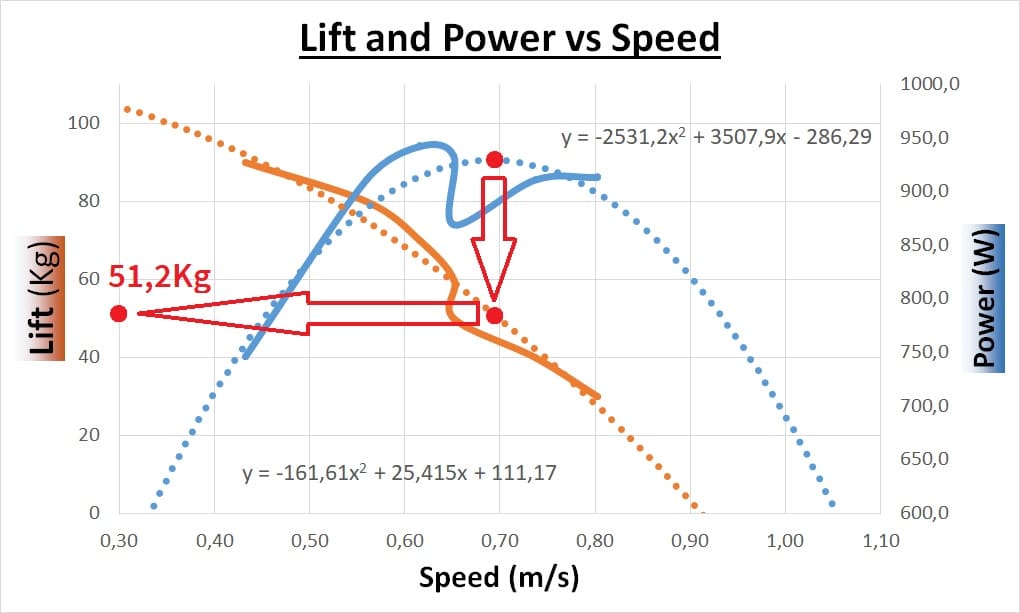
In my case, it’s 51,2 Kg.
Conclusions
Does this mean that I could lift a Muscle Up with 51Kg? This maximum power weight MAY have some relation with your Muscle Up RM (as my current personal best is 45Kg) but that would need some research with a group of people and more data.
What this plot can tell, is that for now, if I want to work for speed or power I should use 51Kg in order to optimize my maximum power capabilities.
What about the 15Kg difference in the peak power between both tests (from 66Kg in the 5 seconds test to 51Kg in the 1 rep test)?
Well, this may be due to the swinging, as if I had done more Pull Ups with the lower weights, the peak would have moved to the left to lower weight. Even though, the second test seems more accurate than the first one, as in the first one we are not taking into account if the athlete completes a half of the way up or down.
Hope this post has been useful. If you realize this test and want to share your results, do it sending an email to workouttemple@gmail.com.
I would like to thank Priscila Torrado, lecturer in Sport’s Science Degree in Barcelona University for the help with the test.
Download the template
[References]
Tous-Fajardo J, Moras G, Rodríguez-Jiménez S, Gonzalo-Skok O, Busquets A, Mujika I. W5″ Test: A simple method for measuring mean power output in the bench press exercise. Eur J Sport Sci. 2016;16(8):940‐947. doi:10.1080/17461391.2016.1184318